Indian start-ups, Insights

Classification of Startups based on Funding Stages

Introduction:

The Indian startup ecosystem is thriving, driven by innovative entrepreneurs and supported by investors, accelerators, and incubators. From the early groundwork of pre-seed to the high-stakes expansion in Series A and beyond, understanding the objectives at each stage is vital for sustainable growth and success.


Image Source: https://inc42.com/reports/indias-top-200-startups-financial-index-report-2023/

Seed Stage:

  • At the pre-seed stage, startups focus on developing a solid business concept, working on partnership agreements, obtaining patents or copyrights, and creating a compelling pitch deck. The emphasis is on laying the groundwork for the business idea.
  • Once the pre-seed stage is completed, the seed stage follows. Here, the startup moves forward with creating a product or prototype based on the established business concept. The objective is to raise initial funds and get the business up and running.
  • Funding Sources in Seed Stage: Self, family and friends, Micro VCs.
  • But unfortunately, only 1 out of 3 startups successfully pass on to the Series A funding stage.
  • At this stage, startups may encounter failure due to financial constraints and an improper product-market fit among other reasons.


Data Source: Why Fewer Than 1 In 3 Seed-funded Indian Startups Get Series A Funding – Forbes India

Proportion of U.S. seed funded companies that raised post-seed funding

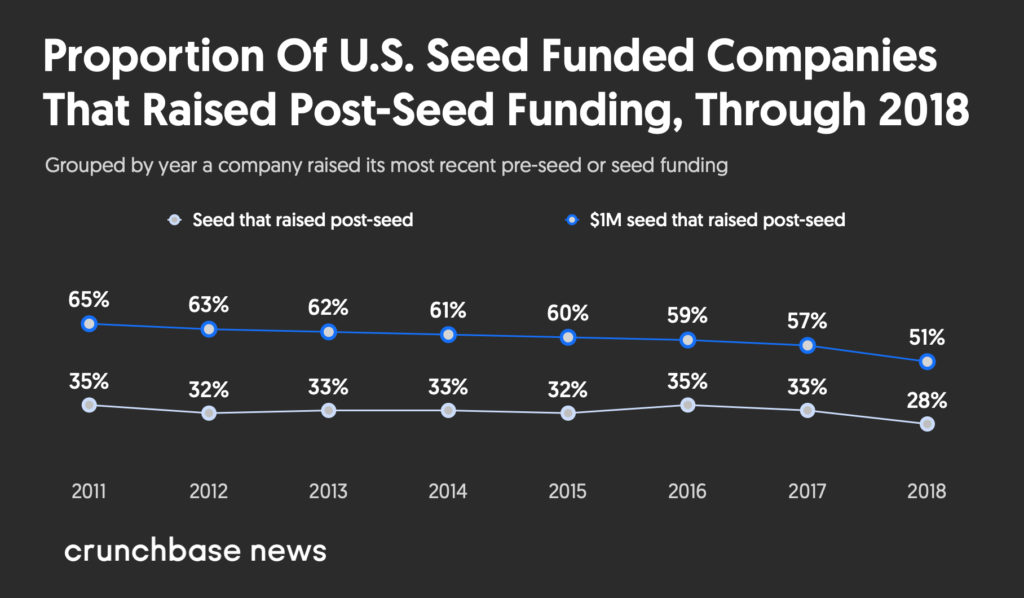
Image Source: What Are The Odds Of Success For A US Seed Funded Startup? (crunchbase.com)


Series A:
This stage involves-

  • Researching industry and markets to identify growth opportunities.
  • Writing a comprehensive business plan to outline strategies for expansion.
  • Launching marketing and advertising efforts to gain customer traction.
  • Generating revenue and aiming for profitability.
  • Planning to scale into new markets.
  • Funding Sources: Accelerators, Super angel investors, Venture capitalists.


Series B:
In Series B, startups focus on-

  • Expanding consumer interest and market presence.
  • Establishing a commercially viable product or service for scalability.
  • Scaling production, marketing, and sales to meet growing demand.
  • Funding Sources: Venture capitalists, Late-stage venture capitalists.


Series C & beyond:
In this stage, the startups concentrate on-

  • Continuously innovating by building new products and exploring new markets.
  • Establishing a strong position in the industry.
  • Attracting investments from venture capitalists and late-stage venture capitalists for substantial growth.
  • Funding Sources: Late-stage venture capitalists, Private equity firms, Hedge funds, and Banks.


Exit:

  • Making an initial public offering (IPO) to offer shares to the public and provide liquidity to investors becomes a potential exit strategy.
  • An exit through a sale or via VCs or SPACs is another way for investors and founders to realize the value of their investments.


Conclusion:

Startups not only create jobs and spur technological advancements but also disrupt traditional industries, fostering competition and pushing boundaries. Startups play a pivotal role in shaping economies, driving prosperity, and shaping the future. From Pre-Seed to Exit, the lifecycle of a startup represents an exciting journey filled with challenges, breakthroughs, and transformative impact.


Read more about Indian Startups: The Fast Track to Funding Your Startup: Convertible Notes, CCD, CCPS, SAFE

Economy & Market, Insights

India’s Thriving D2C Sector

Introduction

D2C, a flourishing business model on the rise in India, involves brands selling their products directly to consumers, eliminating the need for traditional retail intermediaries. With more than 800 emerging brands adopting this strategy, D2C has experienced remarkable growth, allowing brands to establish direct connections with consumers and meet their demands effectively.

The Covid-19 pandemic acted as a catalyst, accelerating the expansion of prominent D2C brands, especially those with a robust online presence, leading to a substantial surge in consumer demand. The Indian D2C market is expected to reach $100 billion by 2025.

Image Source: Statista | Numbers are in Billion USD


Traditional vs D2C business Model:

       Traditional Model

  • Relies on intermediaries (middlemen) for reaching consumers.
  • Limited control over customer experience.
  • Indirect customer feedback.
  • Higher cost.

        D2C Model

  • Bypasses intermediaries.
  • Direct control over customer experience.
  • Access to customer feedback.
  • Lower costs.

Direct-to-consumer market size by Channel:

Image Source: Statista

Top D2C contributors by 2025


Major growth factors:

D2C space has immense potential due to various factors including:

  • The growing young population and middle class in India, which has more disposable income to spend on D2C products.
  • The changing preferences of Indian consumers, who are increasingly looking for high-quality, affordable products that are delivered directly to their doorsteps.
  • Rapid Digitization: The rise of the internet, mobile phones and advancements in payment systems like UPI has made it easier for consumers to shop online.
  • Technological advancements: Brands can leverage technology and collaborate with enablers such as crowdfunding platforms, social media, ecommerce platforms, payment gateways, and logistics providers to overcome funding and resource challenges.
  • Low penetration of organized retail in India, access to innovative products at affordable prices, and delivery of great quality products to the remotest corner of India.
  • Government support: Government support in terms of funding, liberalization, fueling digital e-commerce and related policies have served as a push for the augmentation of the market.


Key Brands:


Data Source: Inc42


Importance of Logistics in the D2C space:

Logistics play a crucial role for D2C brands in India, ensuring efficient delivery of products directly to consumers.
Streamlined logistics operations are essential for maintaining customer satisfaction and loyalty in the competitive market.

  • In-House Fulfilment: Companies manage the entire process in-house without any help from 3rd party logistics providers. Best suited for new D2C businesses or small ecommerce stores 
  • Fulfilment By Marketplaces: Ecommerce marketplaces through which companies sell their products undertake all fulfilment activities. Best suited for smaller or emerging brands.

  • Third-party logistics service providers:  Companies outsource the entire fulfilment process to these third-party logistics service providers. Best suited for large and growing ecommerce stores. 


Conclusion:

India’s abundant asset lies in its population, encompassing skilled IT professionals, entrepreneurs, and diverse job classes, all embracing the D2C model. Being one of the youngest nations globally, with an average age of 29 and 66% of its population below 35, India presents immense market potential. With 1.15 billion mobile phone users, the Indian D2C segment offers a promising avenue for growth in the upcoming years.


Read more about Economy and Market: The Rising Middle Class: Fueling India’s Luxury Market Revolution

Indian start-ups, Insights

The Fast Track to Funding Your Startup: Convertible Notes, CCD, CCPS, SAFE

The Fast Track to Funding Your Startup: Convertible Notes, CCD, CCPS, SAFE

Introduction:

Fundraising for startups involves investors providing funds in exchange for shares or preference shares of the company. The traditional method, known as a priced round, involves negotiating an equity percentage with investors. However, early-stage companies often opt for an alternative method called a convertible instrument.

Convertible instruments offer advantages such as simplicity and speed in closing deals, allowing startups to secure funding quickly. Another benefit is that founders can maintain control and decision-making power over their company during the crucial early stages of development.


Parameters of Typical Convertible Instruments:

Convertible Notes, CCD, CCPS, SAFEs are some of the most common convertible instruments in the startup ecosystem.
These instruments come with certain parameters which are as follows:

  • Valuation cap: This is the maximum price that an investor is willing to pay for a share of a startup.
  • Discount: This is the percentage discount that investors receive on the valuation cap. The discount is used to incentivize investors to invest in a startup.
  • Liquidation preference: This is the priority that investors have to get their money back if a startup fails. Investors with a liquidation preference will get their money back before other investors, such as founders and employees.
  • Conversion period: This is the time period during which a convertible instrument can be converted into shares.
  • Anti-dilution protection: This is a provision that protects investors from being diluted if the startup issues more shares at a lower price in the future. E.g. Full ratchet.


Valuation Cap:

  • It is a very important concept to understand while raising funds.
  • It is the maximum price at which you will convert an investor’s contribution into equity.
  • Example: Elon invests $2 million into “Firm Z” at a valuation cap of 10 million. In the priced round, Mark invested $2 million in “Firm Z” at a valuation of $20 million.
  • Now the ownership of Elon and Mark will be calculated as follows.

  • Elon and Mark both invested $2 million. But because of the valuation Cap, Elon has more ownership than Mark.
  • Companies either provide a valuation cap or a direct discount.


Convertible Notes:

  • A loan that will be repaid with shares of the company instead of money.
  • Interest rate and maturity date are typically included.
  • The investors are provided with a valuation cap or discount.
  • Example: Investor provides $100 as a convertible note, and with a 12% yearly interest rate, the founder will owe $112 worth of shares when the next financing round occurs.

CCPS (Compulsorily Convertible Preference Shares)

  • These are preference shares that must convert to equity after a set period or achieving predefined milestones.
  • These shareholders are provided with dividends that are paid out annually or accumulated to be paid at a later stage.
  • CCPS converts either at a 1:1 ratio or a higher rate based on liquidation preference and participation.
  • Investors have preference over equity shareholders in a liquidation event and may participate in surplus profits.
  • Founders may prefer CCPS for a guaranteed conversion and potential control in liquidation events.


CCD (Compulsorily convertible debenture)

  • Bond-like instruments that convert to preference or equity shares upon maturity depending on the terms set at the time of issuance.
  • Employed as debt with regular interest payments initially, converts to shares on maturity of debenture.
  • No specific minimum investment varies depending on the startup and investor agreement.


SAFEs (Simple Agreement for Future Equity)

  • No interest rate or maturity date involved.
  • Investor provides funding that converts to shares in the future funding round.
  • Convertible notes offer more flexibility, allowing founders to set a specific conversion trigger, such as a total funding amount, before converting the investment into shares.
  • SAFEs typically require immediate conversion during the next priced round.


Types of SAFEs:

Pre-money SAFE:

  • Example: 1 million at 9 million pre-money valuation would result in valuation of 10 million after funding.
  • Investors have uncertainty about their ownership percentage in the company until the first priced round when all SAFEs convert to shares.
  • Complex calculations required to account for multiple SAFEs and dilution.
  • Pre-money SAFE has potential for less dilution in the long run.


Post-money SAFE:

  • Example: 1 million at 9 million post-money valuation would result in valuation of 9 million even after funding.
  • Investors lock in their ownership percentage at the time of investment, providing clarity and certainty about their stake when the Series A begins.
  • Post-money SAFEs can lead to founder’s ownership percentage being diluted in the future, as fixed ownership percentages are established for each investor.
  • Simplifies negotiations and transparency for both parties.
  • Post-money SAFE gives more clarity and certainty for both founders and investors.


Conclusion:

Startups with minimal revenue can use convertible instruments to raise capital without having to set a valuation. Convertible instruments allow startups to delay setting a valuation until a later date when they have more data and are in a stronger position to negotiate a fair valuation. This can be a major advantage for startups, as it gives them more time to grow and develop their business before they have to give up equity.


Read more about Every Student is Different: The Journey of a Promising Startup

Economy & Market, Insights

The Rising Middle Class: Fueling India’s Luxury Market Revolution

The Rising Middle Class: Fueling India’s Luxury Market Revolution

Introduction:

The luxury market in India has been growing steadily, even in the face of global challenges such as recession, the pandemic, and high inflation. This segment has proven to be recession-proof and continues to attract consumers.


The Size of the Luxury Market:

  • Globally, the luxury market was around 1.6 trillion dollars as of 2022.
  • The market is divided into various segments, with luxury goods, cars, hospitality, and personal goods accounting for approximately 80% of the market.
  • Smaller segments include fine wines, gourmet food, homeware, fine art, and private jets.


Image Source: Deloitte

India’s Luxury Market Potential:

  • India’s Luxury Market is at around 8.5 billion dollars currently.
  • According to Bain, by 2030, India’s luxury market could reach a staggering 200 billion dollars.

Image Source: Fortune India

India’s Rising Wealth:

  • India’s middle class is set to emerge as its largest group by 2047, also contributing the most to the nation’s income.
  • India is home to the third-highest number of billionaires in the world, with a collective net worth of approximately 675 billion dollars.
  • The growing aspirations of common people, including millennials and Gen Z, contribute to the growth of the luxury market in India.
  • The middle-class population is estimated to reach 102 crore out of the projected total population of 166 crore in 2047, constituting approximately 61 per cent. In contrast, the middle-class population stood at 43.2 crore in 2021.
  • Growing middle class will have more discretionary money which they will spend on discretionary and luxury products. 

Luxury Fashion, Retail & Cosmetics:

  • The luxury fashion retail segment is expected to grow at a compounded annual growth rate (CAGR) of 20-25% over the next decade.
  • Entry barriers for luxury brands in India have reduced, leading to an influx of international brands.

Hospitality and Weddings:

  • The hospitality segment, driven by higher disposable incomes and the big fat wedding industry, plays a significant role in the luxury market’s growth.
  • International hotel chains are expanding their presence in India, capitalizing on the demand for luxury accommodations.
  • Luxury hotel chains are also tapping into the booming wedding market in India.

Luxury Cars, Motorcycles:

  • India witnessed sales of around 38,000 luxury cars in the previous year, with a projected growth in the secondary market.
  • Challenges such as high import duties and taxation affect the growth of the luxury car segment in India.
  • Luxury car brands are witnessing a shift in the consumer demographic, with more first-generation entrepreneurs and women entrepreneurs entering the market.

Challenges and Opportunities:

  • Challenges in the luxury market include income inequality, environmental impact, and rising counterfeits.
  • Conscious consumers are demanding sustainable luxury experiences and products.
  • Luxury brands are embracing sustainability and working with craftsmen to build sustainable practices.


Conclusion:

India’s luxury market shows immense potential for growth, with projections reaching up to 200 billion dollars by 2030. The rise of conscious consumers and their demand for sustainable luxury experiences presents both challenges and opportunities for the industry. As more international brands enter the Indian market, the landscape of luxury in India is set to evolve further.

Read About: The Relationship Between Macroeconomics and Stock Markets

Economy & Market, Insights

India’s Electronics Sector and its Phenomenal Growth Potential

India’s Electronics Sector and Its Phenomenal Growth Potential

Introduction

  • The Indian electronics sector holds immense potential for multibagger returns in the next five to ten years.
  • The electronics sector, essential for advancements in AI, IoT, EVs, and 5G, is set to experience significant growth due to various factors.
  • In this post, we’ll explore the Indian electronic sector ecosystem, including the value chain, business models, mega trends, and the position of India specifically in the Electronics Manufacturing Services (EMS) space.

Total Electronics market –  India (Value in INR billion)


India’s electronic goods exports and production by value – $ billion  (Source: IBEF)


Value Chain of the Electronic Manufacturing Services (EMS) Industry:

  • EMS companies provide various manufacturing services to electronics OEMs (original equipment manufacturers).
  • Services include design, sourcing, manufacturing, assembly, testing, distribution, and after-sales services.
  • Electronics OEMs, such as Apple, outsource manufacturing to EMS service providers.


Key differences: OEM vs EMS vs ODM

OEM (Original Equipment Manufacturer)

  • They design and market complete products or certain sub-systems or components for their customers.
  • While they design most of their products themselves and own the intellectual property rights to them, they increasingly outsource all or part of their manufacturing to third parties such as EMS providers.

EMS (Electronic Manufacturing Services)

  • They are contract manufacturer in the electronics field.
  • These providers not only make products for OEMs but also offer a wide array of value-added services.
  • These services include support with initial ideation and design, DfX (Design for Excellence), supply chain management, configure-to-order, outbound logistics, and repair elements1.

ODM (Original Design Manufacturer)

  • It is a company that designs and manufactures products that are eventually marketed and sold under the name of an OEM.
  • OEMs buy products from ODMs, who adapt their reference design to the OEM’s requirements2.

The distinction between ODM and EMS has become blurred over the years, with EMS offering a range of design services to their clients. However, EMS typically gives OEMs more control over their IP and decision-making than an ODM would


HVLM vs. LVHM

  • HVLM (high volume, low mix): Large quantities of a few types of products, such as consumer electronics like TVs, washing machines, and mobiles. Example: Dixon Technologies, Amber Enterprise etc.
  • LVHM (low volume, high mix): Emphasis on quality and customization, serving industries like aerospace, defense, medical equipment, etc. Example: Example: Kaynes Technologies, Cyient DLM etc.


End Industries in the EMS Space

Positioning of Indian EMS Industry in the Global Landscape:

  • China dominates the global EMS industry but faces rising labor costs and reduced dependency from US MNCs.
  • India’s EMS industry is expected to grow over three times in the next three to four years.
  • Currently India holds a share of around 2.2% in the global EMS space, but it is expected to grow to 7% by 2026.
  • Factors driving growth include increasing demand for electronics, government initiatives like Atmanirbhar Bharat, PLI Schemes,
    and the $10 billion incentive for semiconductor ecosystem setup.
  • India has clearly drafted its ambition to achieve US$ 120 billion worth of exports by 2026.

EMS Market Share by Geography


Estimated Export Trends of Indian Electronics Industry by 2026 (US$ billion)

Source: Vision Document on Electronics Manufacturing (Electronics Production in India)


Challenges for the Indian EMS Industry:

  • Competing with China’s cost advantage and technological expertise.
  • Lack of electronic component ecosystem resulting in higher import costs.
  • The Indian EMS industry needs to become more efficient and competitive to capture a larger share of the market.


Conclusion

  • The Indian electronics sector, with its thriving EMS industry, presents significant growth potential for long-term investors.
  • Understanding the value chain, business models, mega trends, and industry positioning is crucial for building conviction before investing.
  • While challenges exist, India’s government initiatives and growing demand for electronics indicate a promising future.
  • As India aims to become a prominent alternative to China, the Indian EMS industry has the opportunity to emerge as a prominent global player.

Read About: Against the Tide: India’s Stable Economy Amidst Global Challenges

Indian Stocks, Insights

IDFC First Bank: Fundamentally Strong Bank with Good Growth Prospects

IDFC First Bank: Fundamentally Strong Bank with Good Growth Prospects


IDFC First Bank, formed by the merger of the former IDFC Bank and Capital First in 2018, is a prominent Indian banking institution. Led by MD/CEO V. Vaidyanathan, it has transitioned from a corporate-focused low NIM bank to a retail-focused high NIM bank. With 641 branches and 719 ATMs across India, the bank is expanding its operations. Under Vaidyanathan’s leadership, it has witnessed significant growth in scaling up digital cash management, trade forex, wealth management etc. IDFC First Bank is well-positioned as a leading player in the Indian banking sector, driven by strong management and a focus on key financial indicators.

Sources of Revenue: (FY23)

The bank has seen a solid growth in Net Interest Income and Fee income compared to the previous financial year. NII has grown by 30.1% while the fee income has grown by 54%.


Key highlights:

1.Stable CASA Ratio:

IDFC First Bank maintains a stable Current Account and Savings Account (CASA) ratio, consistently around 50% which is better than HDFC and ICICI bank who are the top players in the industry.

2. Lower Cost to Income Ratio:

The bank has successfully reduced its cost to income ratio from around 95% in 2019 to approximately 72.5% in FY23.

3. Improved Asset Quality:

IDFC First Bank has experienced significant enhancements in asset quality and client base. Gross and Net NPAs have come down significantly when compared to the last financial year.


4. Enhanced ROE and ROA:

IDFC First Bank has witnessed an impressive increase in return on equity and return on assets. These improvements highlight the bank’s efficient capital utilization and improved profitability.

5. Higher Retail Deposits:

Over the years bank has to moved to a more retail centric approach resulting in lower NPAs.

6. Profit: 

YOY profit has risen by 1575%. (FY22-145 crores, FY23- 2,437 crores)

7. IDFC first bank has an attractive P/B valuation ratio of 2.29 when compared to its peers. (Kotak Mahindra – 3.77, AU Small Finance bank-6.17, IndusInd – 2.13)

8. Loans and Advances saw a 24% growth compared to the last financial year (currently at Rs. 1,60,599 Cr).

9. Higher Net Interest Margin: With interest margins at 6.05%, IDFC First Bank outperforms the likes of HDFC and ICICI. This indicates the bank’s ability to generate higher interest income from lending activities.


10 year view:

For IDFC first bank, we see a 15-17% CAGR growth in book value in the next 10 years.

Reasons include the bank’s solid CASA ratio, increasing NII margin, lower costs and various other solid financial indicators.

The FII stake in the bank is currently at 20% which is very low compared to its peers and hence more FII inflows are expected due to the solid performance of the bank which will also aid in the growth of the bank.

Also India economy is bound to grow rapidly in the next few decades and banking is the backbone of our economy. IDFC First will capitalize on this growth which will reflect in the books of the bank.


We estimate the stock to grow by atleast 7 times or grow by a CAGR of 21.73% in the next 10 years.

Disclaimer: This research is for informational purposes only and does not constitute investment advice. Please do your own due diligence and consult your financial advisor before making any investments.

You can invest in Stocks through Zerodha.

To open an account with Zerodha, please provide information below.


Read more about Ethos Ltd: The Luxury Watch Retailer with a Bright Future

Financial Products

Portfolio Management Services: Grow your wealth with the help of experts

Introduction

  • Portfolio Management Services (PMS) are personalized investment products designed to meet the unique needs and objectives of investors.
  • Managed by experienced professionals who conduct extensive research and evaluate securities.
  • PMS is popular among high-net-worth individuals (HNIs) due to its ability to optimize returns through investments in equity, commodities, and other assets.

Image Source: Taurus Group


Minimum Investment Requirement:

  • The minimum investment requirement to invest in PMS in India is Rs.50 lakhs.
  • This was increased from Rs. 25 lakhs in November 2019 by the Securities and Exchange Board of India (SEBI).
  • Also, the portfolio manager must have assets worth at least Rs. 5 crores in order to be eligible to manage PMS portfolios.


Types of PMS:

  • Discretionary PMS gives the portfolio manager full discretion to make investment decisions on your behalf. This means that you do not have to be involved in the day-to-day management of your portfolio.
  • Non-discretionary PMS gives you more control over your portfolio. The portfolio manager will provide you with investment recommendations, but you will have the final say on whether or not to make a trade.


PMS Fee/Charges: (Varies based on the type of fund)

  • Management fee: This is the most common fee charged by PMS providers and is calculated as a percentage of the total assets under management (AUM). It is typically between 1% and 2.5% of the AUM.
  • Performance fee: This fee is charged only if the PMS scheme generates positive returns. The performance fee is typically between 10% and 20% of the profits generated.
  • Entry load: Some PMS providers may charge an entry load, which is a one-time fee that is charged when you invest in a PMS scheme. The entry load is typically between 0% and 2% of the investment amount.
  • Exit load: Some PMS providers may charge an exit load, which is a fee that is charged when you exit a PMS scheme. The exit load is typically between 0% and 2% of the investment amount.


Benefits of using PMS:

  • Expert guidance: PMS providers have a team of experienced investment professionals who can help you develop an investment strategy that is right for you.
  • Customized solutions: PMS providers can create a customized investment solution that meets your specific needs and objectives.
  • Professional management: PMS providers manage your portfolio on a full-time basis, so you don’t have to worry about the day-to-day trading.
  • Transparency: PMS providers are required to provide you with regular updates on the performance of your portfolio.


Advantages of PMS over mutual funds:

  • More Personalized Service: PMS providers can provide more personalized service than mutual funds. This is because PMS providers have a smaller number of clients and can tailor their investment strategy to each client’s individual needs.
  • More Flexibility: PMS providers have more flexibility in the types of investments they can make. This allows them to take more risks and potentially generate higher returns.


Criteria to choose a PMS provider:

  • Experience: Look for a PMS provider with a team of experienced investment professionals.
  • Track record: Research the track record of the PMS provider to see how their portfolios have performed in the past.
  • Fees: Compare the fees of different PMS providers to find the one that best fits your budget.
  • Services: Consider the services that are offered by different PMS providers. Some providers may offer additional services, such as tax planning or estate planning.


Conclusion

  • Portfolio Management Services (PMS) in India offer personalized investment solutions tailored to meet the unique needs of investors.
  • PMS attracts serious investors with its effective risk management, transparency, and expert guidance.
  • By opting for PMS, investors can benefit from professional portfolio management and work towards achieving their financial goals with more transparency.

If you want to explore PMS, please reach out to us.

Financial Products

Equity Mutual Funds – How to evaluate, compare and pick ?

Equity mutual funds are investment vehicles that pool money from multiple investors to invest predominantly in stocks or equities of various companies. They offer investors the opportunity to participate in the potential returns and growth of the stock market, managed by professional fund managers.

Investing in equity mutual funds can be an exciting way to grow your money over time. However, before you dive in, it’s crucial to familiarize yourself with some important terms that will help you make informed investment decisions.

Formulae mention in this article is only for the purpose of understanding and it is not necessary for an investor to remember these formulae.

Beta

Beta is a measure of risk that tells us how much a mutual fund’s returns typically move in relation to the overall market. The formula to calculate beta is:

Beta = Covariance(Fund Returns, Market Returns) / Variance(Market Returns)

A beta less than 1 indicates that the fund may be less volatile than the market, which implies lower risk. A beta greater than 1 suggests the fund could be more volatile, indicating higher risk. In general, a lower beta is considered better for conservative investors, while a higher beta may be suitable for those seeking higher returns at a higher risk.


Alpha

Alpha measures a mutual fund’s ability to outperform its benchmark index, considering the risks taken by the fund manager. A positive alpha suggests that the fund has performed better than expected, while a negative alpha means the fund underperformed. A higher alpha is generally considered better.

Example: Fund B has generated an alpha of 2%. This implies that the fund has outperformed its benchmark index by 2% after adjusting for the risk it took. Positive alpha indicates the fund manager’s skill in generating excess returns.


Standard Deviation

Standard deviation shows how much a mutual fund’s returns have varied from its average return over time. It measures the fund’s volatility. A higher standard deviation indicates greater volatility, while a lower standard deviation suggests more stable returns. Lower standard deviation is generally preferred for conservative investors.

Comparing standard deviation with the industry benchmark would give a better idea about the volatility of the particular fund.


Sharpe Ratio

The Sharpe ratio assesses the risk-adjusted returns of a mutual fund. It measures the excess return earned per unit of risk taken. The formula to calculate Sharpe ratio is:

Sharpe Ratio = (Fund’s Return – Risk-Free Rate) / Standard Deviation of Fund’s Returns

(90-day Treasury bill rate is taken as risk-free rate)

A higher Sharpe ratio indicates better risk-adjusted returns. Therefore, a higher Sharpe ratio is generally preferred.


Capture Ratio

It is metric to evaluate how well the fund captures both upside and downside returns. Comparing the fund’s capture ratio with that of its category provides insights into its relative performance in different market conditions.

Example: Fund X has an upside capture ratio of 99, indicating that it captures 99% of the positive returns of the benchmark index. Its downside capture ratio is 119, implying that it captures 119% of the negative returns of the benchmark. A lower downside capture ratio is generally preferred as it means the fund has managed to avoid a significant portion of the benchmark’s losses during market downturns. Ideally, investors seek a mutual fund with a capture ratio close to or above 100% for positive returns and below 100% for negative returns, signifying outperformance during upward movements and minimized losses during downward movements.


Expense Ratio

The expense ratio represents the annual fees charged by the mutual fund company for managing the fund. It is expressed as a percentage of the fund’s assets. A lower expense ratio is generally better for investors as it means lower costs.

Note: Expense ratio is deducted from the total investment, not just the profits.

Image Source: ValueResearch.com


Rolling Returns

Rolling returns calculate investment returns over specific periods, like one, three, or five years, continuously moving forward. They give a comprehensive perspective on a mutual fund’s performance by considering various holding periods. By analyzing rolling returns, investors can evaluate a fund’s consistency and stability over time, filtering out short-term fluctuations.

Rolling returns are a more useful metric of investment performance than CAGR with respect to mutual funds. This is because mutual funds are often subject to significant volatility, and CAGR can be misleading in these cases. Rolling returns can help to smooth out the volatility and provide a more accurate picture of the fund’s performance over time.


You can invest in Mutual funds through Zerodha.

To open an account with Zerodha, please provide information below.

Indian start-ups

Financing the Electric Revolution: Game-Changing EV Financing Startup

Embracing electric vehicles (EVs) is crucial for a sustainable future, but financing EVs has been a challenge for dealers, manufacturers, and lenders especially in Tier 2, Tier 3 and rural parts of India. This article explores a startup that engages with dealers, manufacturers, lenders and borrowers to make the process simple. This company is capitalizing on the growing demand for EVs. The government’s plan to phase out ICE vehicles by 2030 opens up a big market for electric 2 wheeler and 3 wheeler vehicles. The below graphs show the market of 2 wheeler and 3 wheeler EVs for the upcoming years.

Overcoming Financing Challenges: Navigating the world of EV financing is not without its hurdles. Dealers and manufacturers face difficulties in partnering with lenders, limited financing options, and technological gaps. These challenges result in long approval times and frustrating experiences for customers especially in Tier 2, Tier 3 and rural areas. Lenders also struggle with assessing risk and managing relationships with EV dealers effectively.

The Solution –  Loan Origination

To address these challenges and simplify the EV financing process, a cutting-edge platform has been developed. With this platform, loan approvals become a seamless experience for customers. This platform offers a simple and user-friendly process for loan origination. It connects customers, dealers with multiple lenders through standardized partnership agreements, eliminating the complexities of seeking financing. AI based assessment model speeds up the loan evaluation process  to just 5 minutes, and if approved disbursement happens in less than 48 hours ensuring quick access to funds for purchasing EVs.

Loan Management

Say goodbye to complex financing procedures. QR based efficient system is used to help borrowers repay with ease even on a daily basis which is a significant solution which is never seen before. Also, the company facilitates lenders by providing them with client access and ensuring prompt recovery through the use of IoT devices for EMI collection. Complex paperwork is eliminated in the process.


Unlocking Opportunities for Last Mile Logistics:

Recognizing the importance of last mile logistics providers in the EV industry, this platform enables swift financing solutions. It goes beyond traditional credit scores, considering factors like work experience analysis to extend loans to a wider range of borrowers.

Driving Market Growth:

This innovative platform arrives at a time of increasing demand for EVs. Supported by the Indian government’s commitment to phasing out gasoline-powered vehicles by 2030, it is poised to drive market growth. With substantial financial support for the EV industry, this platform is leading the way towards a sustainable and electrified future.

Revenue Drivers:

  • The growing demand for EVs will create a large market.
  • The Indian government announced that it plans to phase out all gasoline-powered vehicles by 2030.
  • The Indian government is providing financial support to the EV industry which includes subsidies for the purchase of EVs, tax breaks for EV manufacturers, and investments in charging infrastructure.

Margin Drivers

  • Company’s ability to secure EV financing for last mile logistics solution providers within minutes is a major competitive advantage.
  • Company focuses on all systems including Loan Origination system, Loan Management & Collection.
  • By leveraging their advanced technology, they provide loans to people without the need for CIBIL score by assessing the metrics based on the borrower’s work experience analysis.
  • The launch of Finayo’s Electroboost, a 500CR fund in collaboration with its EV ecosystem partners including lenders, Axis Trust, Aeris, and OEMs, will serve as a significant margin driver for the firm.

USP/Competitive Advantage

  • Company is capturing markets in the most populated states of India in Tier 2 and Tier 3 cities and hence lower competition.
  • The company helps lenders by getting them access to clients and ensuring timely recovery by use of IOT devices for collection of EMIs.
  • The firm has introduced daily collection system from the 3-wheeler borrowers which is not done till now in India.
  • Having already established a presence in rural areas, the company will find it easier to expand into urban locations with the help of technology.

Risks:

  • The Indian government is still in the process of developing regulations for the EV market.
  • There are a number of other companies that are developing similar financing solutions.
  • The firm needs to differentiate itself from its competitors in order to be successful. This could be done by offering lower interest rates, or more flexible repayment terms.

Conclusion

The growth drivers outweigh risks making it a compelling investment. As the EV revolution gains momentum, this platform continues to lead the industry forward by providing accessible and efficient financing solutions. With their customer-centric approach and innovative technologies, they are driving the transition towards a sustainable and electrified future.

Title Image Credits: Atherenergy


ASK: $ 1M (received commitments of 0.5M)

Minimum Investment: $12,500

RISK: High Risk

ROI Potential:5X-7X

Time Horizon: 4 years

If you want to know more about the company, register your details below.

1 2 5 6 7 8

Open a Demat account with

– No. 1 Broker in India
– For Indian Stocks & MFs
– For Residents & NRIs
– Flat Brokerage per Order
– Best User Experience

OPEN ACCOUNT

Start investing in

– Start-Ups with Revenue
– Early & Growth Stages
– All Sectors
– Seed Stage to Series B
– Moderate to High Risk
– 3X to 10X Potential

REGISTER NOW
Privacy Settings
We use cookies to enhance your experience while using our website. If you are using our Services via a browser you can restrict, block or remove cookies through your web browser settings. We also use content and scripts from third parties that may use tracking technologies. You can selectively provide your consent below to allow such third party embeds. For complete information about the cookies we use, data we collect and how we process them, please check our Privacy Policy
Youtube
Consent to display content from - Youtube
Vimeo
Consent to display content from - Vimeo
Google Maps
Consent to display content from - Google
Spotify
Consent to display content from - Spotify
Sound Cloud
Consent to display content from - Sound
Cart Overview

Request a Report

We will do our best to share it within 2 working days:

For e.g. 15th March '20 to 18th March '20